The Reciprocity Network
The universe-scale graph of who names whom in executive-pay peer selection — and what it reveals about benchmarking upward.
What we did
We did something at Velarion this spring that, as far as we can establish, no one has done at scale before: we computed the entire directed graph of executive-compensation peer selection. Every company in our coverage names a group of peers in its annual compensation disclosure — the set of firms its board benchmarks pay against. Read one at a time, those lists are unremarkable. Read all at once, as a single graph of who names whom, they describe a structure: a map of who anchors the market's sense of competitive pay, who reciprocates, and who quietly benchmarks upward toward names several times their size.
The timing is not incidental. Proxy season 2026 is in motion, and peer-group construction has become one of the most scrutinized inputs in the qualitative frameworks investors and proxy advisors apply to executive pay. A peer group that skews large inflates the percentile math that justifies a pay number; a peer group that no one else recognizes invites the question of how it was built. The graph we describe here is the first universe-scale answer to a question every compensation committee and every institutional investor asks in isolation: relative to everyone else, is this company's peer set defensible?
The dataset
The graph is built from named-peer disclosures across 1,184 active companies in twelve industries. We construct it as a directed graph: each node is a company, and a directed edge runs from a company to each peer it names. We take one edge per ordered (company, peer) pair, drawn from each company's single most-recent disclosure — the "what investors see today" view. Self-references are excluded (there are none), and named peers that resolve to no public ticker — private firms, foreign issuers, and the handful of names our resolver cannot place — are excluded from the graph because they cannot be nodes; they account for under two percent of raw disclosures.
Of 1,184 active companies, 991 — 83.7% — disclose a named peer group we can place in the graph. The remaining 193 are mostly smaller banks and recently public companies that disclose no peer group at all.
That 83.7% figure is the discipline line for this paper, and we lead with it for the same reason Paper 1 led with its 92.7% say-on-pay join rate: a universe-scale claim is only as honest as the share of the universe it actually covers. The 193 non-disclosing firms are not a data gap — many are community banks and survey-benchmarked issuers that genuinely name no peer group, a pattern concentrated in Banking and among emerging-growth companies. Where a company discloses nothing, it contributes no edges and is absent from every ranking below. Every number in this paper is computed over the 991 disclosing firms unless stated otherwise.
The resulting graph holds 3,270 nodes and 29,858 directed edges. Of those nodes, 1,155 are active-universe companies and 2,115 are out-of-platform firms — companies outside our twelve industries that active firms name as benchmarks. Out-of-platform firms are full nodes: their edges count toward the in-degree and out-degree of the active firms they touch, because the most consequential finding in this data — that companies benchmark upward toward marquee names — disappears the moment you delete them. They simply never appear in the active-universe rankings. One descriptive statistic frames the whole structure: network density, the share of directed edges that are reciprocated, is 0.316. Just under a third of all naming is mutual; 4,717 pairs of companies name each other. The rest is one-directional — and the direction is the story.
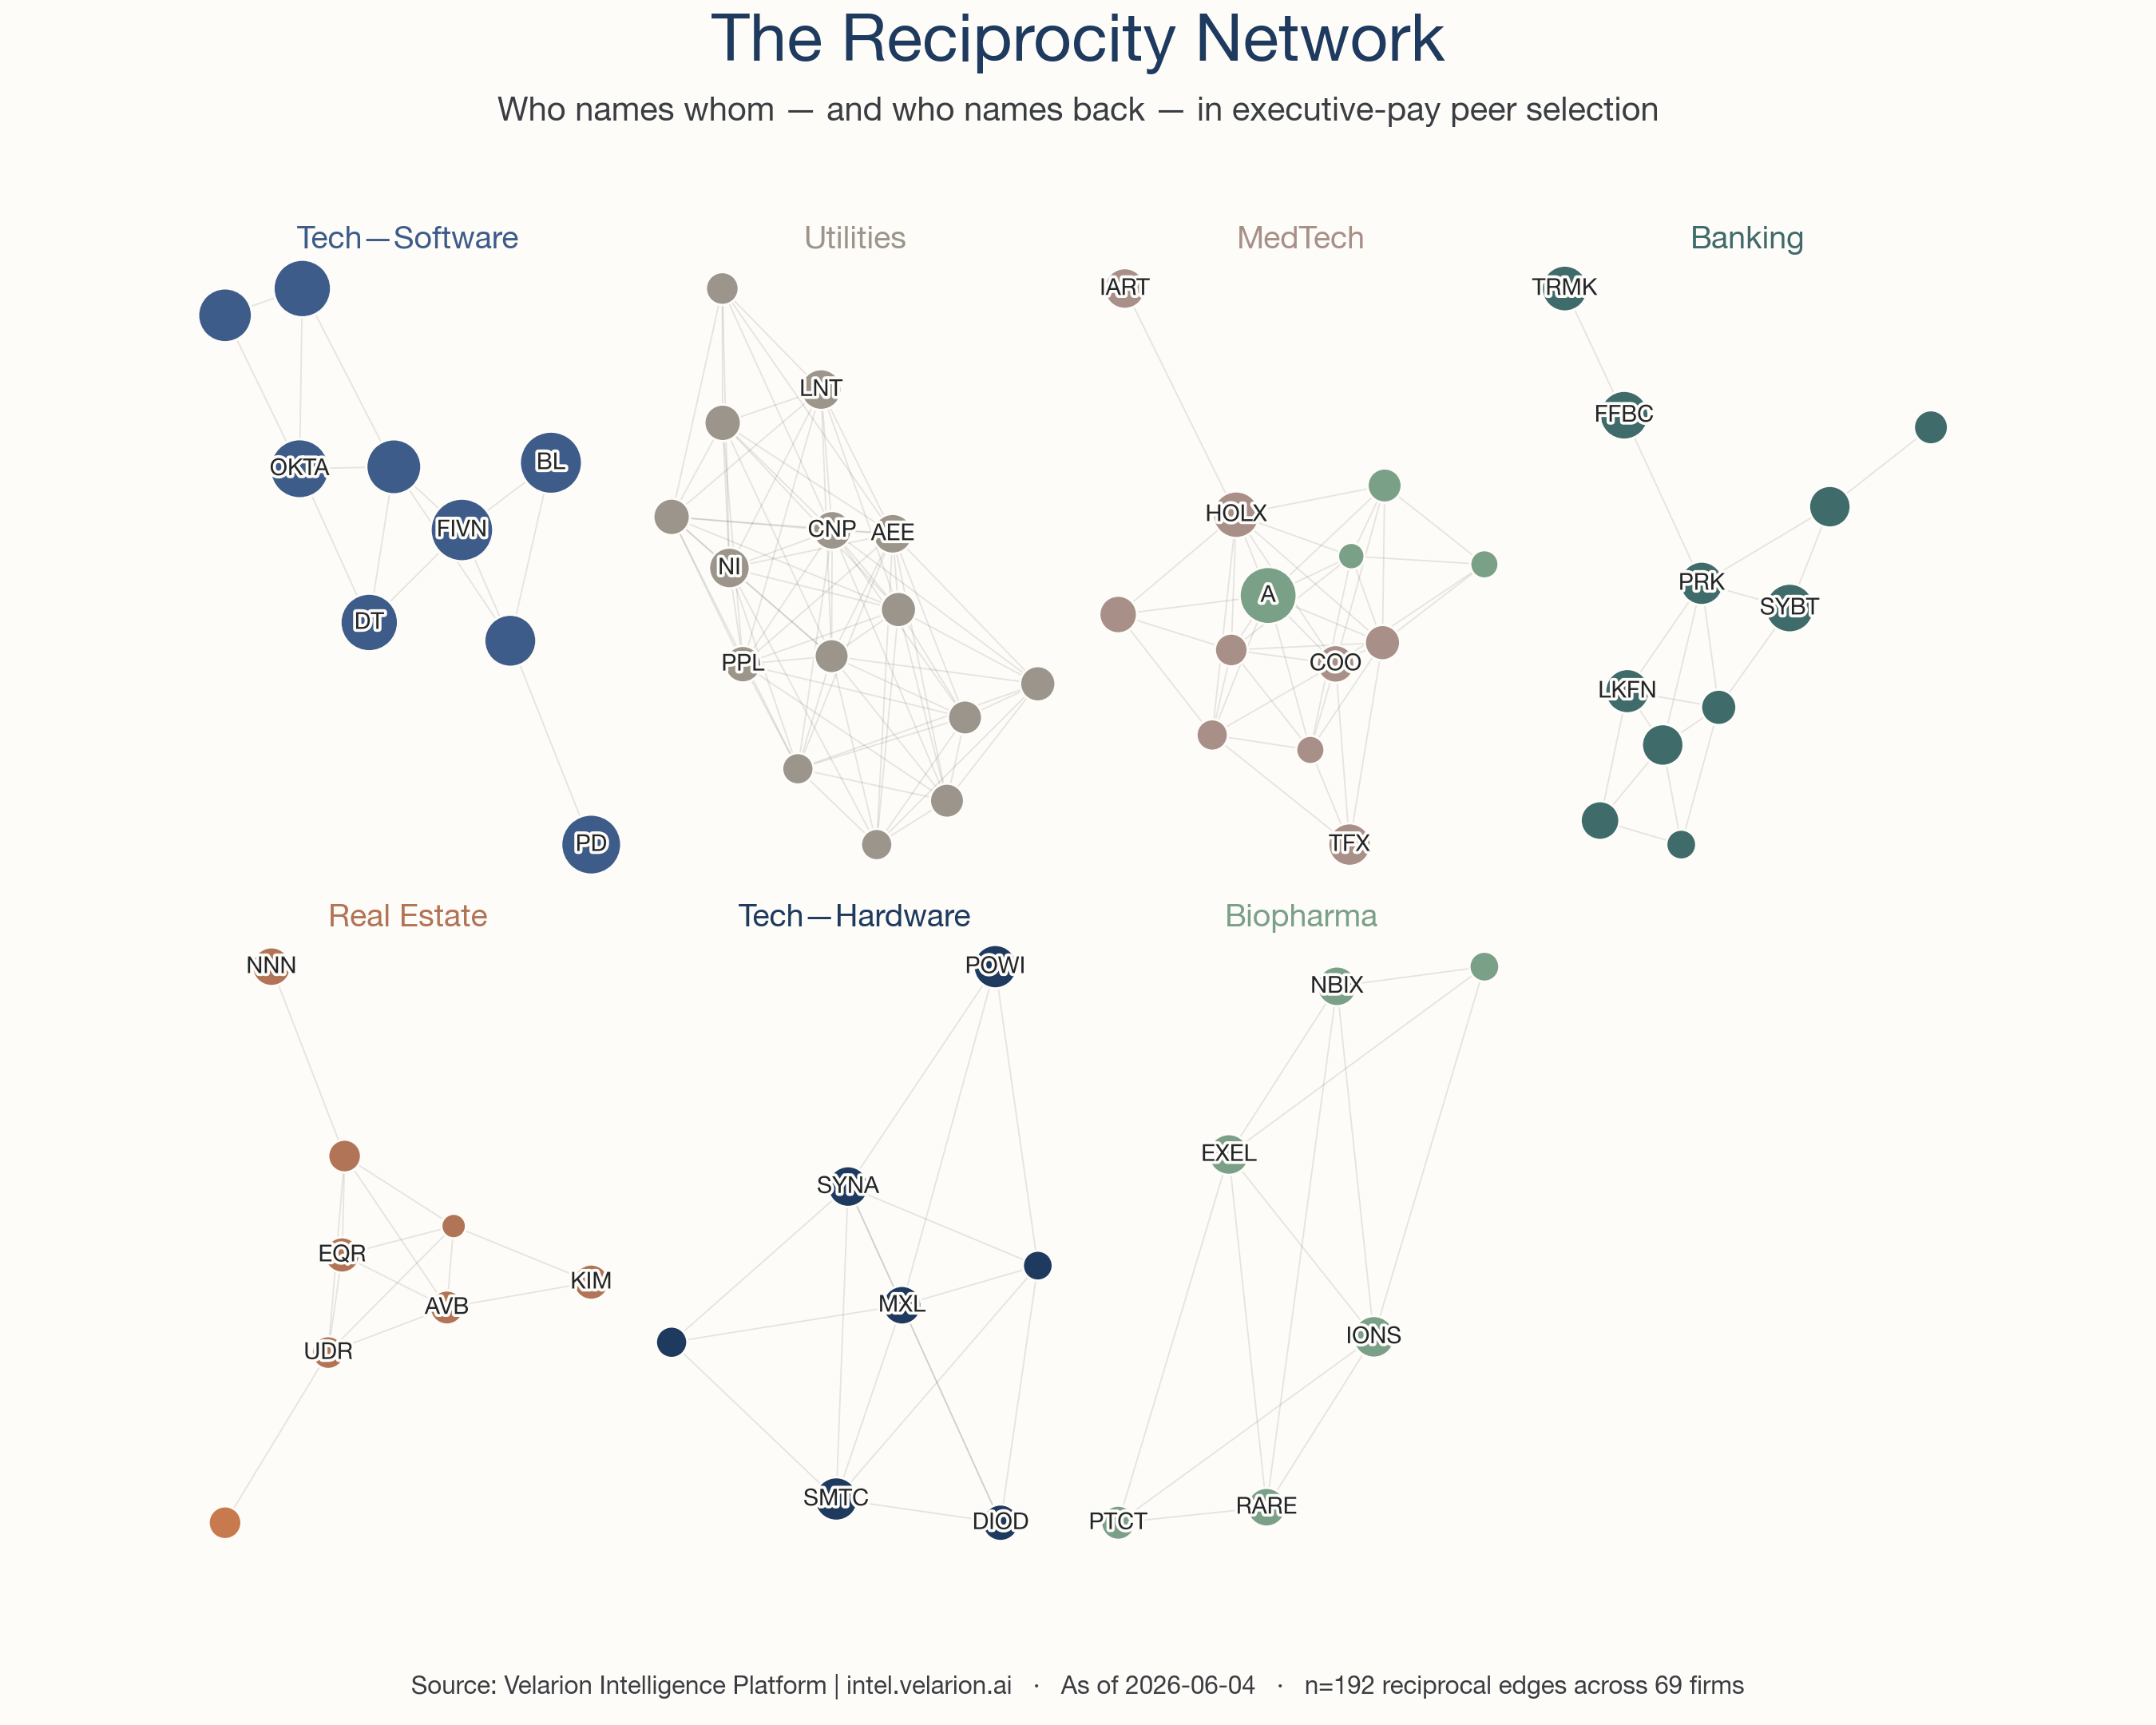
The reciprocity champions
The first question a graph like this answers is who sits on the most peer lists. In-degree — the number of distinct companies that name a given firm as a peer — is the cleanest measure of benchmarking gravity. A high in-degree means the market has collectively decided your pay is the reference point. The top of that list is strikingly concentrated.
Five9 (FIVN) is named by 66 active-universe companies, more than any other firm in the graph. BlackLine (BL) follows at 65, Guidewire (GWRE) at 61, PagerDuty (PD) at 60, and Okta (OKTA) at 58. The pattern does not break until well down the table: of the top dozen firms by in-degree, eleven are enterprise-software companies, with Agilent (A), at 54, the lone exception. Workday (WDAY), HubSpot (HUBS), Dynatrace (DT), Elastic (ESTC), DocuSign (DOCU), Salesforce (CRM), and Intuit (INTU) all sit inside the top fifteen. The enterprise-software sector is, in a precise and measurable sense, the gravitational center of executive-pay benchmarking in the United States.
Reciprocity rate — the share of a company's own named peers that name it back — separates the firms that anchor a mutual community from those that are merely named. Okta (88%), HubSpot (88%), Workday (87%), and Elastic (90%) sit inside dense reciprocal clusters: the firms they name overwhelmingly name them back. Others are named widely but reciprocate little. AppFolio (APPF) is named by 56 companies yet names a peer set our latest-snapshot read resolves to none of them back, for a reciprocity rate of zero; Guidewire reciprocates 44%, Q2 Holdings (QTWO) just 20%. A high in-degree with a low reciprocity rate is the signature of an aspirational anchor — a company everyone benchmarks toward, that benchmarks toward something else again.
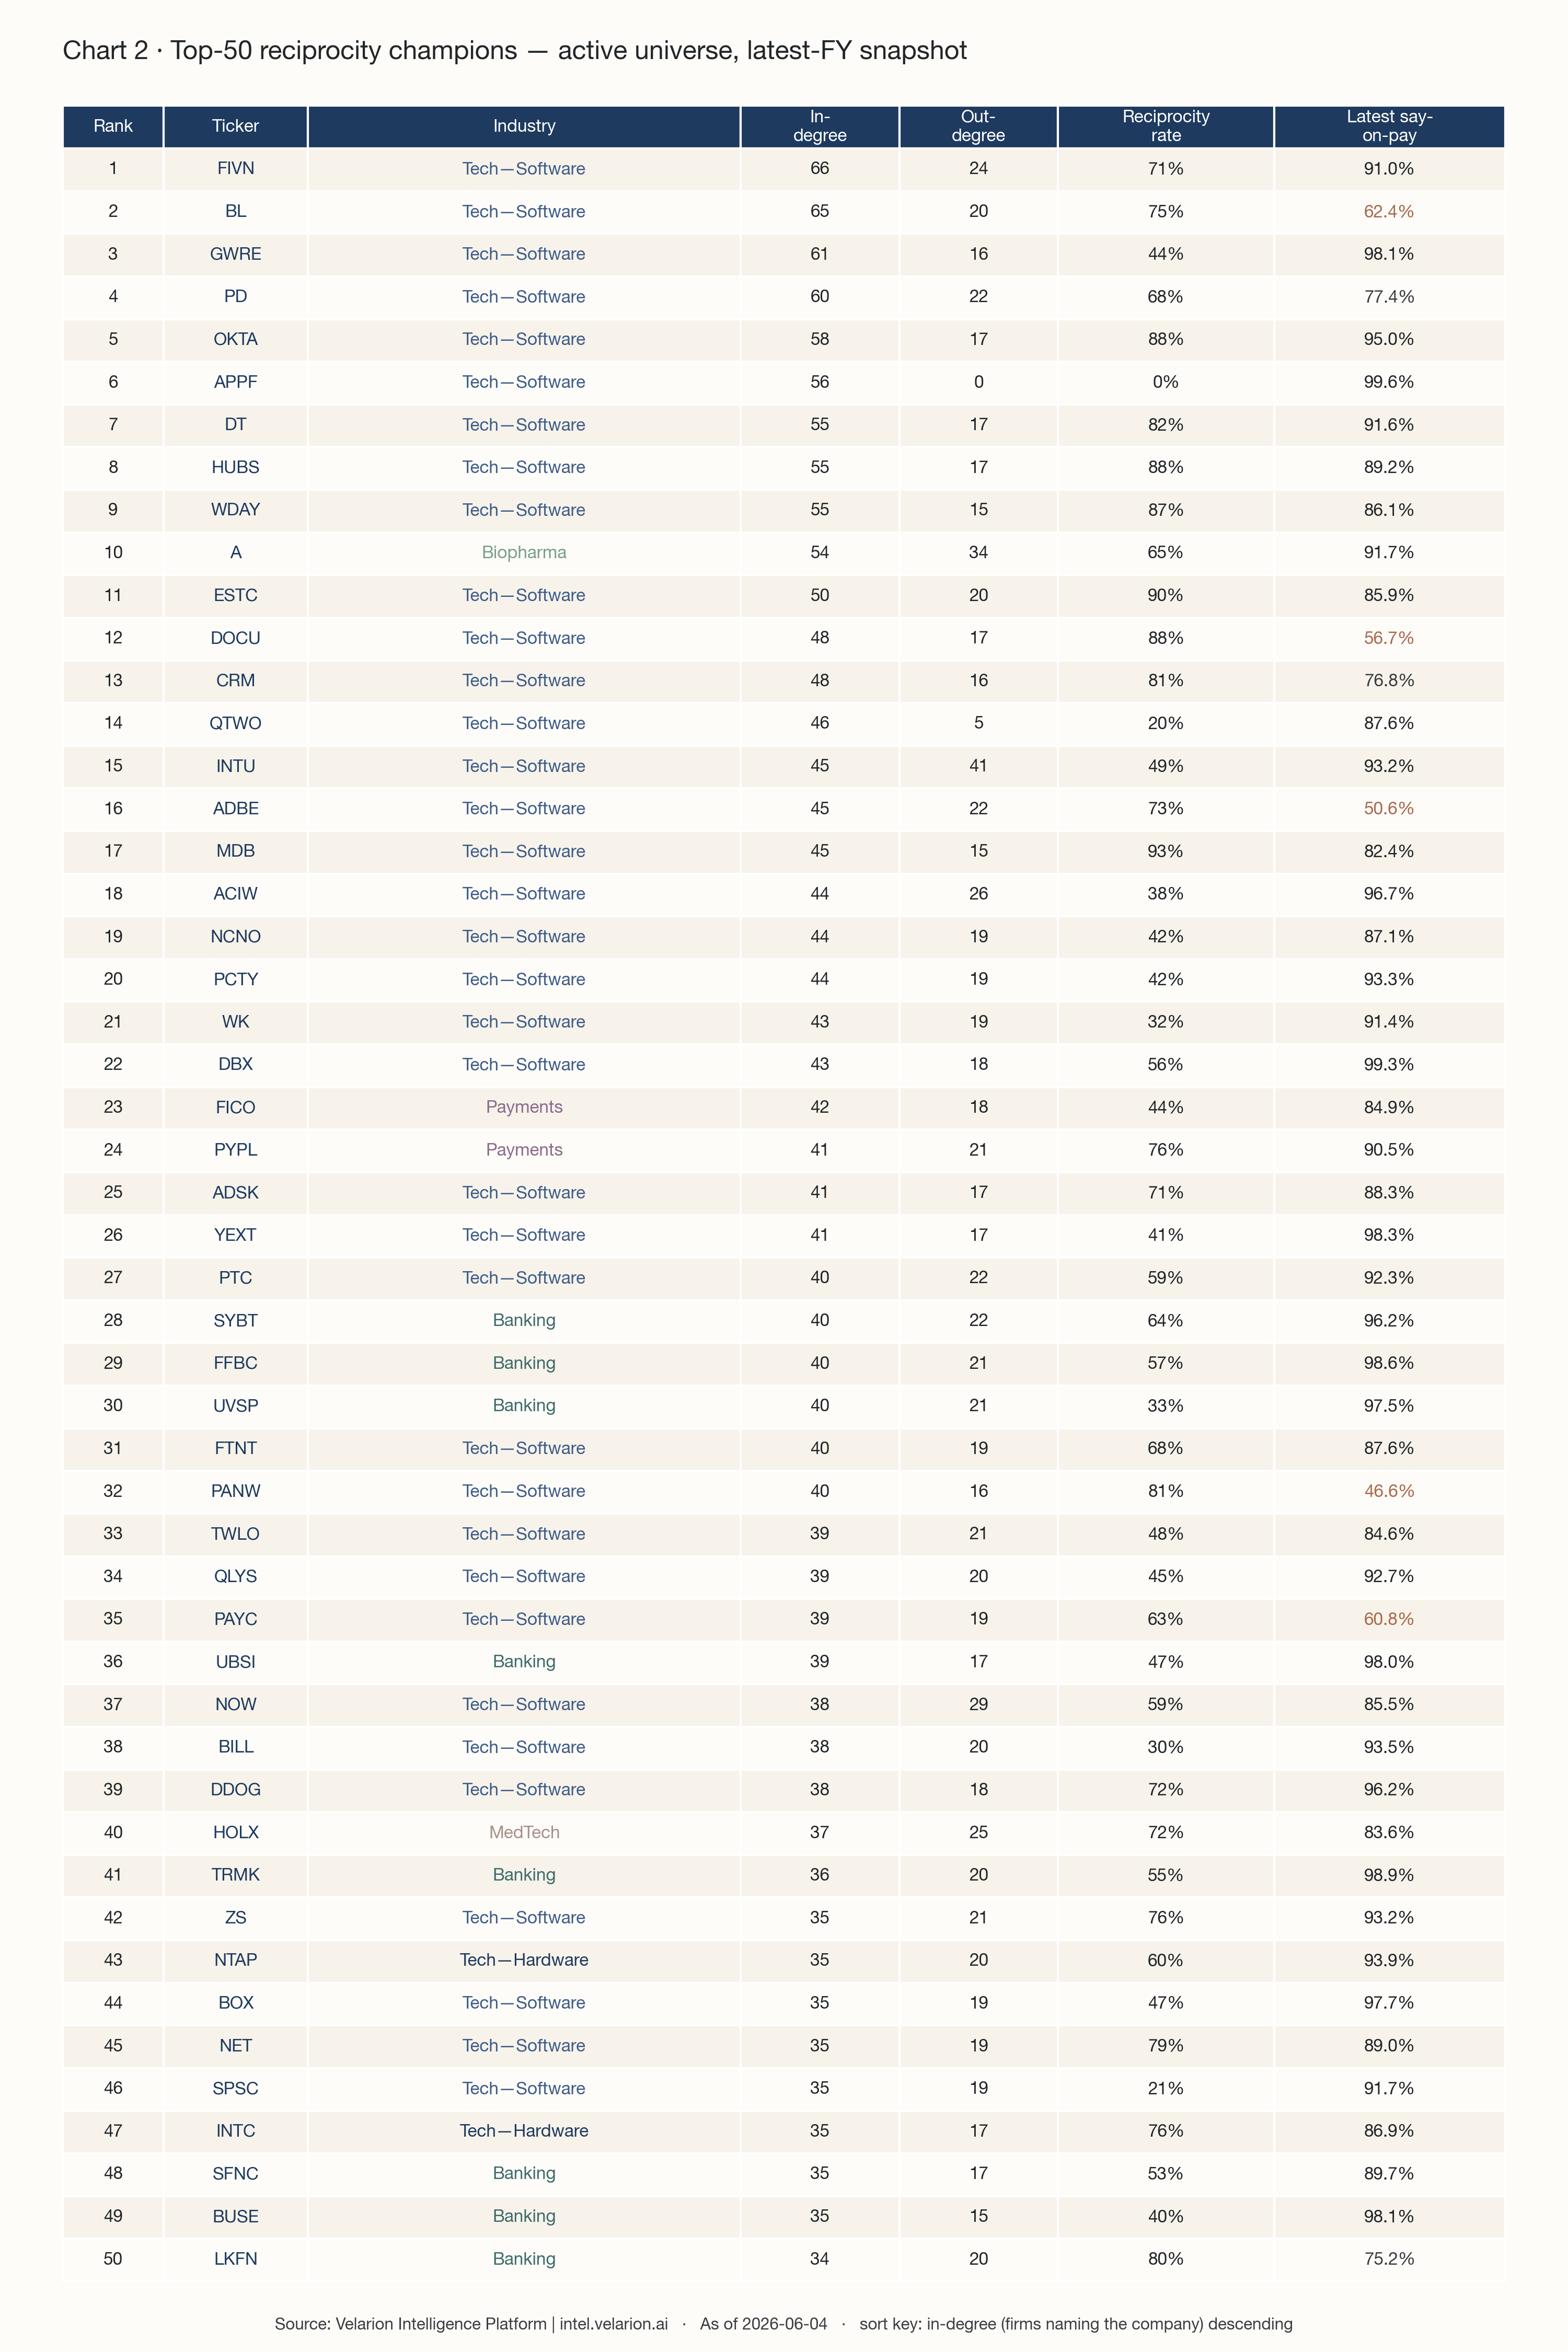
The league table names firms a company benchmarking against any of these industries will recognize. Beyond the software core, the table surfaces Agilent (A) and Charles River (CRL) in Biopharma & Life Sciences, Hologic (HOLX) in MedTech & Diagnostics, FICO (FICO) in Payments & Financial Infrastructure, and a dense band of regional banks — First Financial Bankshares (FFBC), Univest (UVSP), Simmons First (SFNC) — whose mutual benchmarking is among the tightest in the dataset. Several champions also belong to the perennial core described below; we flag them there.
Most-named benchmarks outside the active universe
The marquee finding sits one layer out. When active-universe companies reach outside our twelve industries for a benchmark, they reach toward a recognizable and consistent set of names — and the reach is upward almost by definition, because the companies large enough to sit outside a mid-cap industry index are larger than the companies naming them.
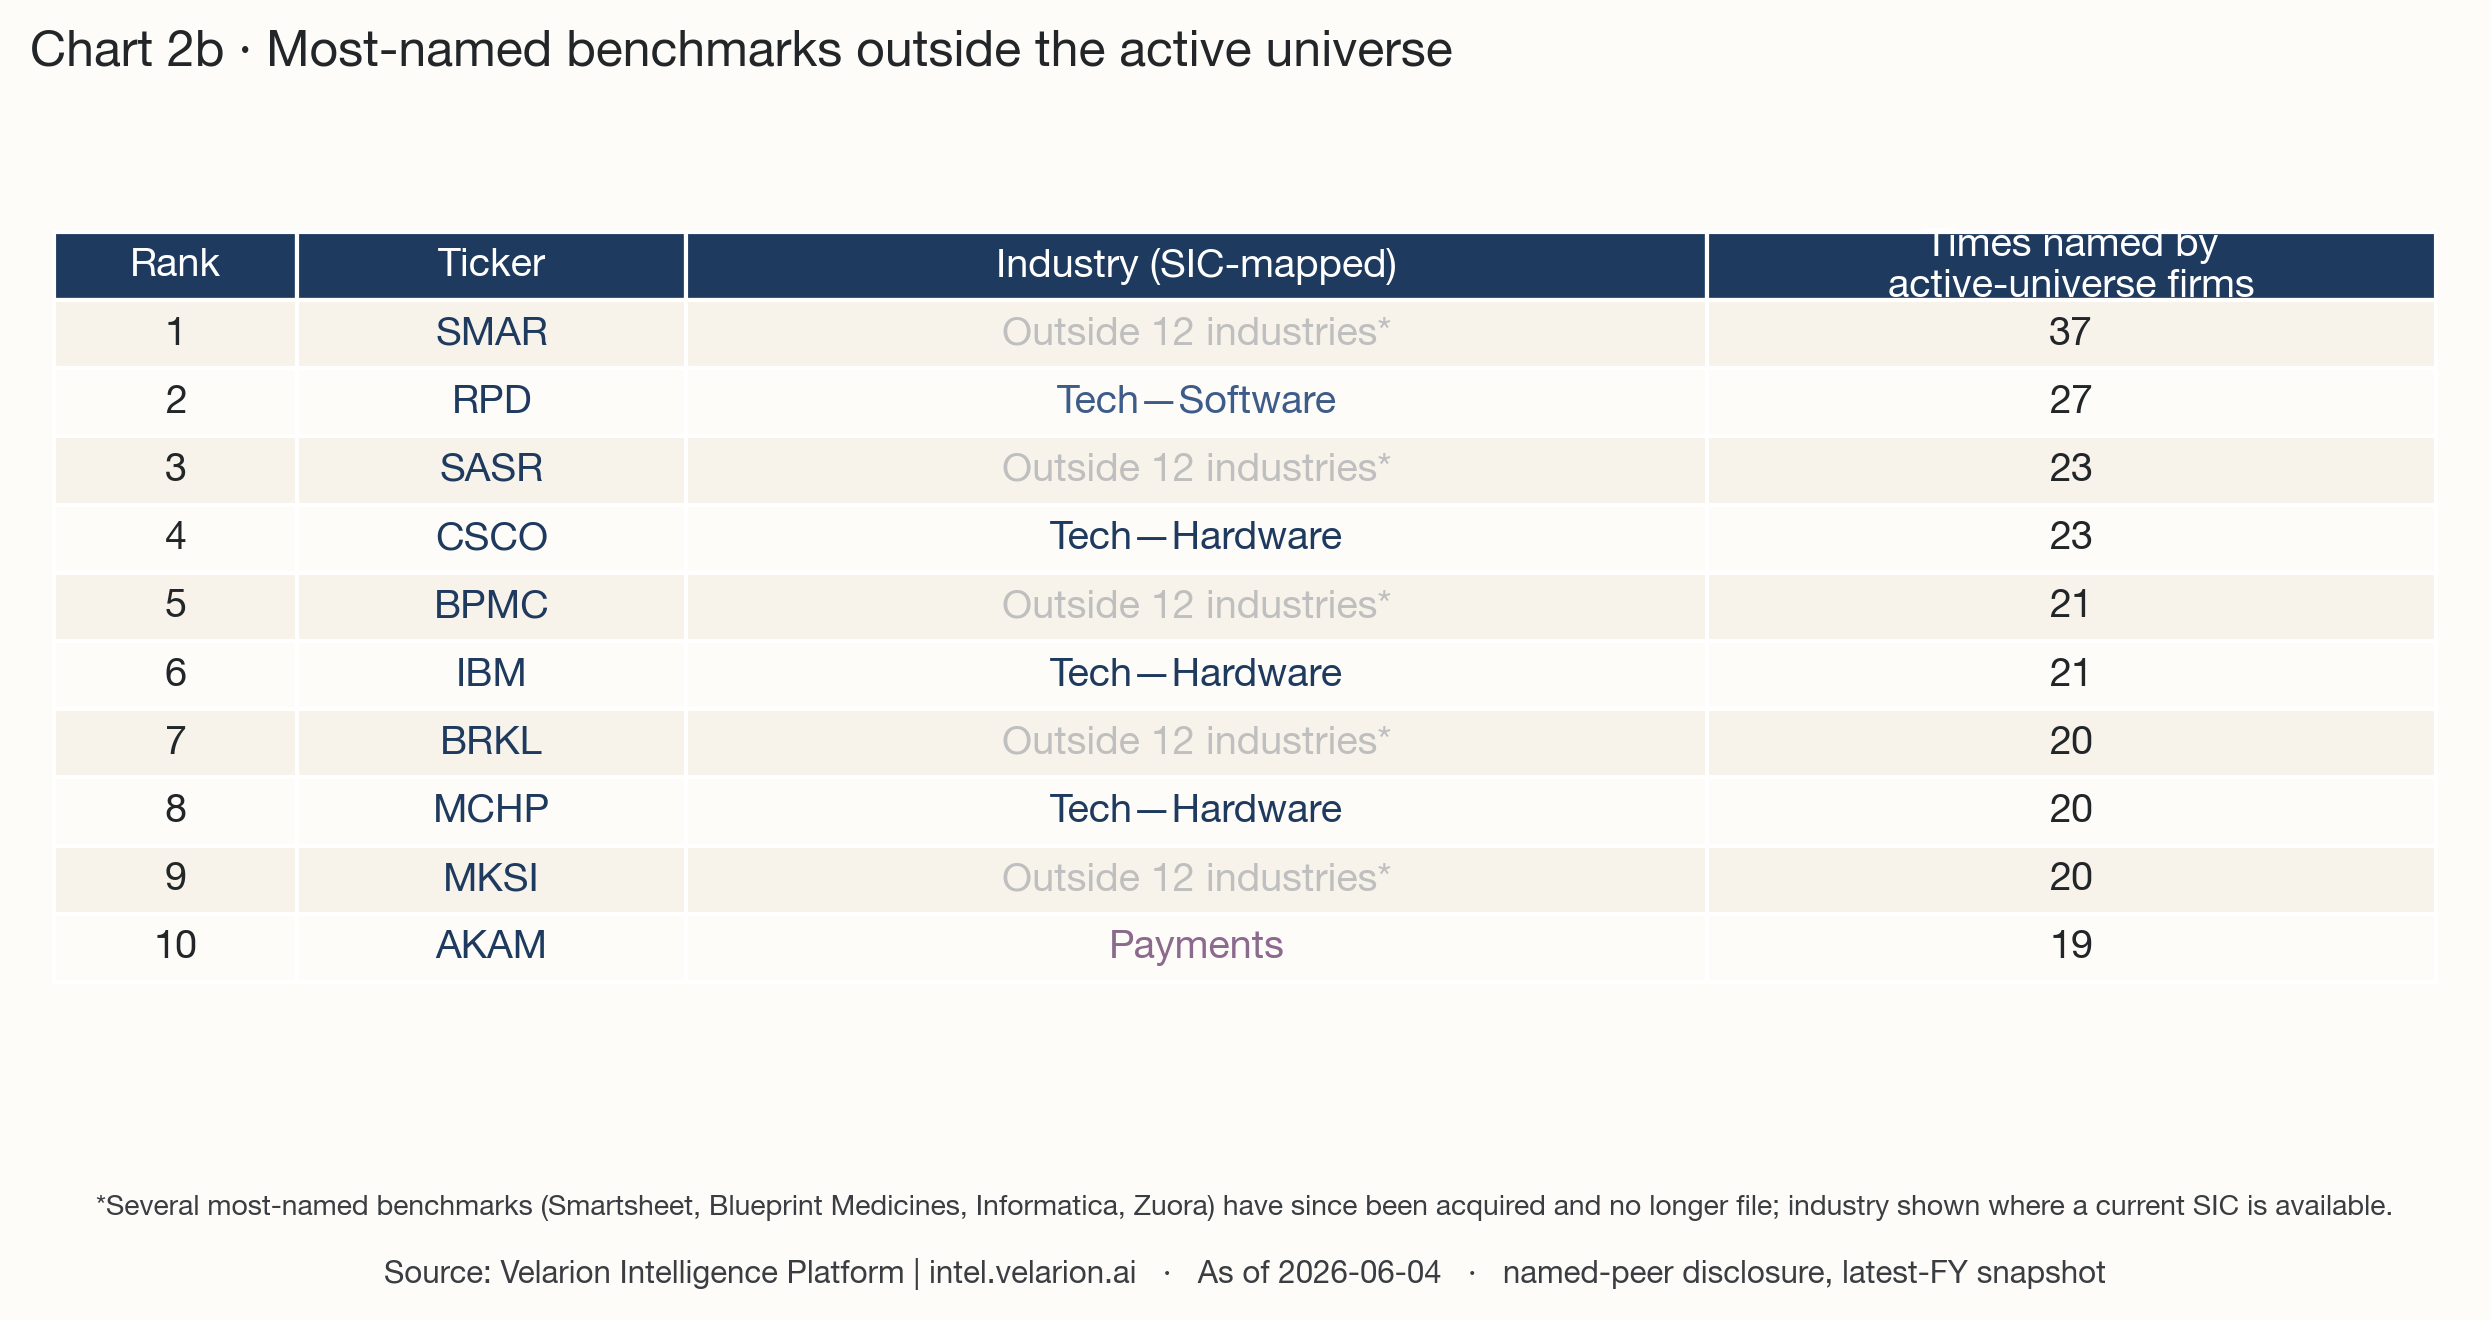
Smartsheet (SMAR) is the single most-named out-of-platform benchmark, cited by 37 active-universe firms, followed by Rapid7 (RPD) at 27, Cisco (CSCO) and Sandy Spring Bancorp (SASR) at 23, and IBM and Blueprint Medicines (BPMC) at 21. The list reads as a catalog of aspirational reference points: enterprise-software names a tier above the mid-cap cohort that cites them, large-cap hardware in Cisco, IBM, and Microchip (MCHP), and a marquee bank or two. A notable share of the most-named benchmarks — Smartsheet, Blueprint Medicines, Informatica, Zuora — have since been acquired and no longer file, which is precisely why they fall outside the active universe: the peer lists that name them were written when they were still independent reference points. The benchmark outlives the company.
This is aspirational peer selection viewed at the level of the whole market rather than a single filing. It is not, on its own, a governance problem — naming a larger, admired peer is a defensible signal of ambition, and investors read it that way more often than not. It becomes a question only when the upward reach is systematic and unreciprocated, which is what the next section measures.
The asymmetry finding
Every company in the graph has two numbers: the market capitalization of the company itself, and the median market capitalization of the peers it names. The ratio of the second to the first is the cleanest available measure of whether a company benchmarks up, down, or at its own weight. We call it the aspirational index.
Across the 970 active-universe firms with a clean market-cap value, the median aspirational index is 1.191 — the typical company names a peer set whose median size is about twenty percent above its own. That modest upward tilt is normal and expected; benchmarking slightly up is how compensation peer groups have always been built. The distribution's upper tail is where the behavior becomes pronounced. The 90th-percentile firm names peers with a median size more than three times its own (3.186×), and 324 firms — roughly a third of the universe — name peers at least 1.5 times their own size.
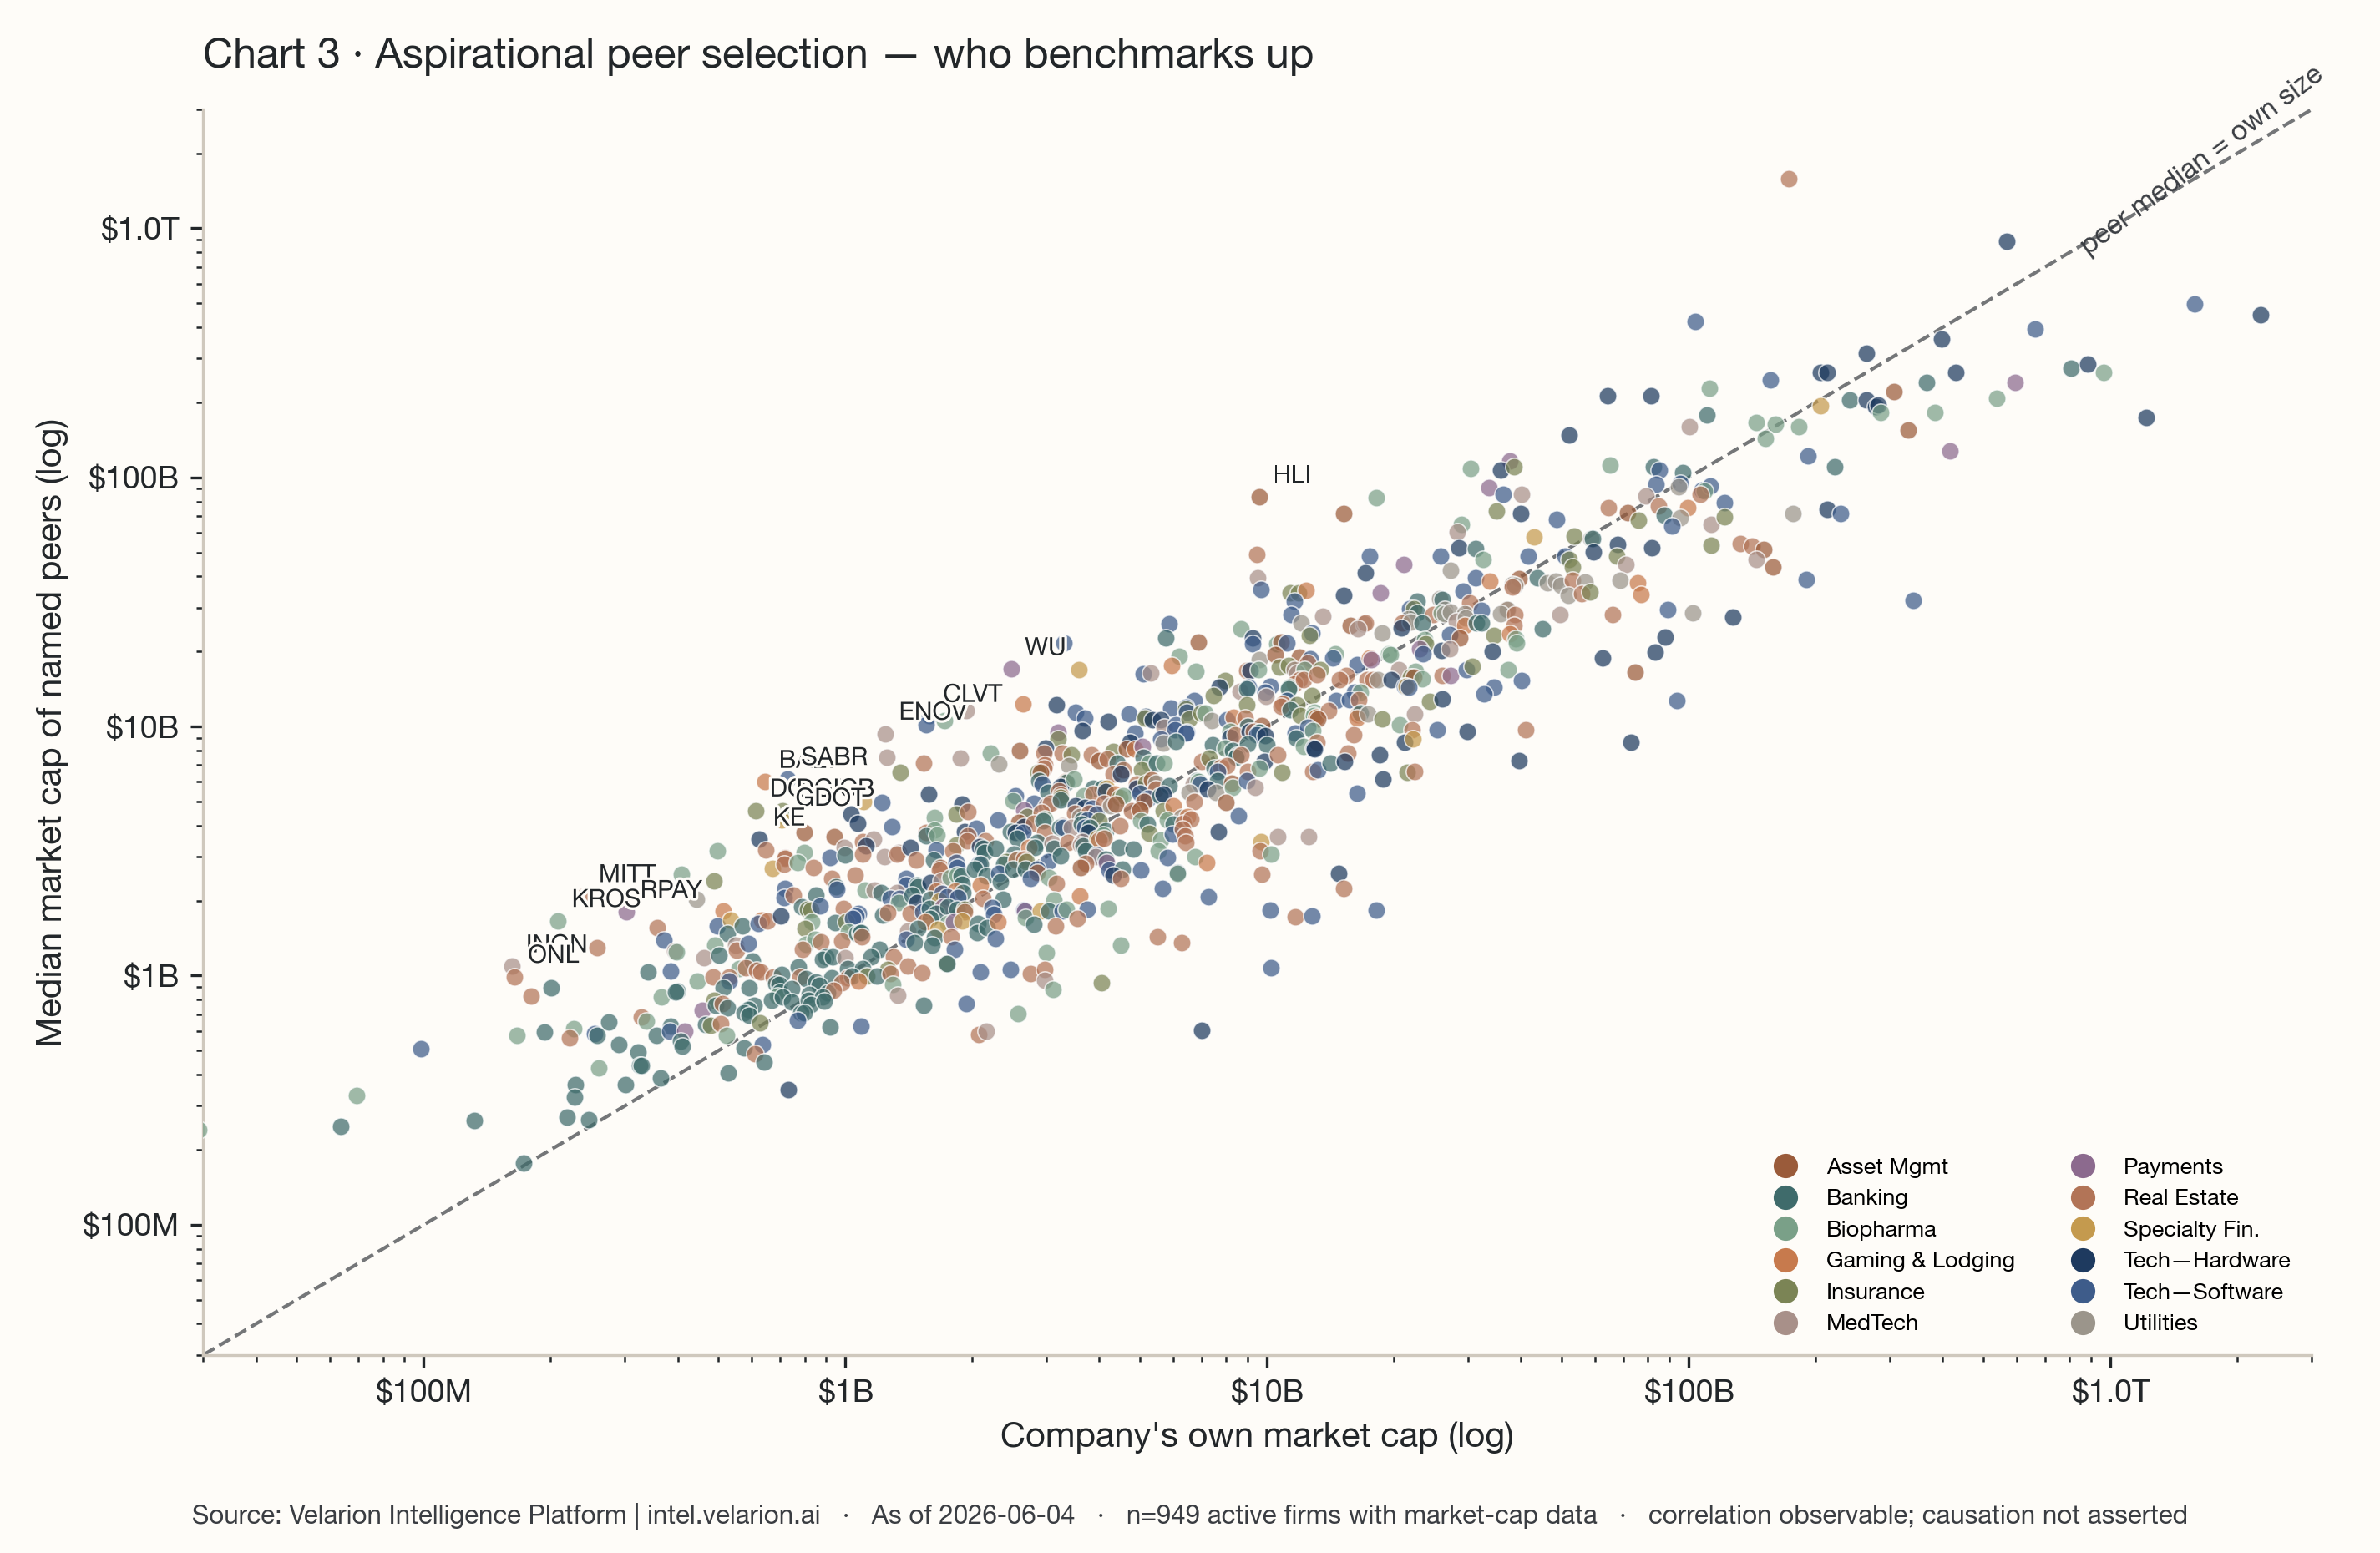
The standouts are specific and, on inspection, coherent. Houlihan Lokey (HLI), a $9.6B advisory boutique, names a peer set whose median sits at $83.6B — JPMorgan, Morgan Stanley, Goldman Sachs, the bulge-bracket banks it competes against for talent rather than mandates. Western Union (WU), at $2.5B, names payments and fintech peers with a $17.0B median. Teradata (TDC) names a software cohort eight times its size; Sabre (SABR), Clarivate (CLVT), and C3.ai (AI) do the same. Enovis (ENOV) benchmarks against the $9.4B-median device leaders — ResMed, Steris, Hologic, Zimmer Biomet. Sarepta (SRPT) names the large-cap biopharma names — Vertex, Alnylam, Incyte — at six times its own size. In every case the upward reach is within the company's own industry; this is not category confusion, it is deliberate aspiration toward the larger firms in the same business. Correlation observable; causation not asserted.
A second, structurally distinct pattern runs underneath the size story. Some firms name many peers while almost no one names them back — high out-degree, low in-degree — regardless of whether the peers are larger. We flag a company as structurally asymmetric when it names at least five more peers than name it and at least twice as many; 237 firms meet that bar. The standouts are not the same firms as the aspirational standouts, and the difference is instructive. Rayonier (RYN) names 41 peers and is named by 2; its aspirational index is 0.62, so it is not reaching up by size — it simply casts a wide, unreciprocated net. DTE-adjacent utility DTG names 26 and is named by none. Charles River (CRL) names 37 and is named by 14. A wide, one-directional peer list is a different signal from an upward one: it can mean a company sees itself as comparable to firms that do not see it the same way, which is exactly the disclosure an investor reads twice.
Both readings are observational. A company that names larger peers is naming larger peers; the data does not say it overpays, and we do not. The aspirational index and the structural-asymmetry test are two lenses on the same underlying act — how a board draws its competitive reference set — and the paper reports both because they disagree often enough to matter.
Cross-industry structure
Aggregated to the industry level, the graph resolves into a clean contrast between industries that benchmark tightly within themselves and industries that benchmark outward. Two numbers capture it: the in-industry reciprocity rate — of the edges that stay inside an industry, the share that are mutual — and the cross-industry edge fraction — of an industry's outgoing edges, the share that point to a different industry.
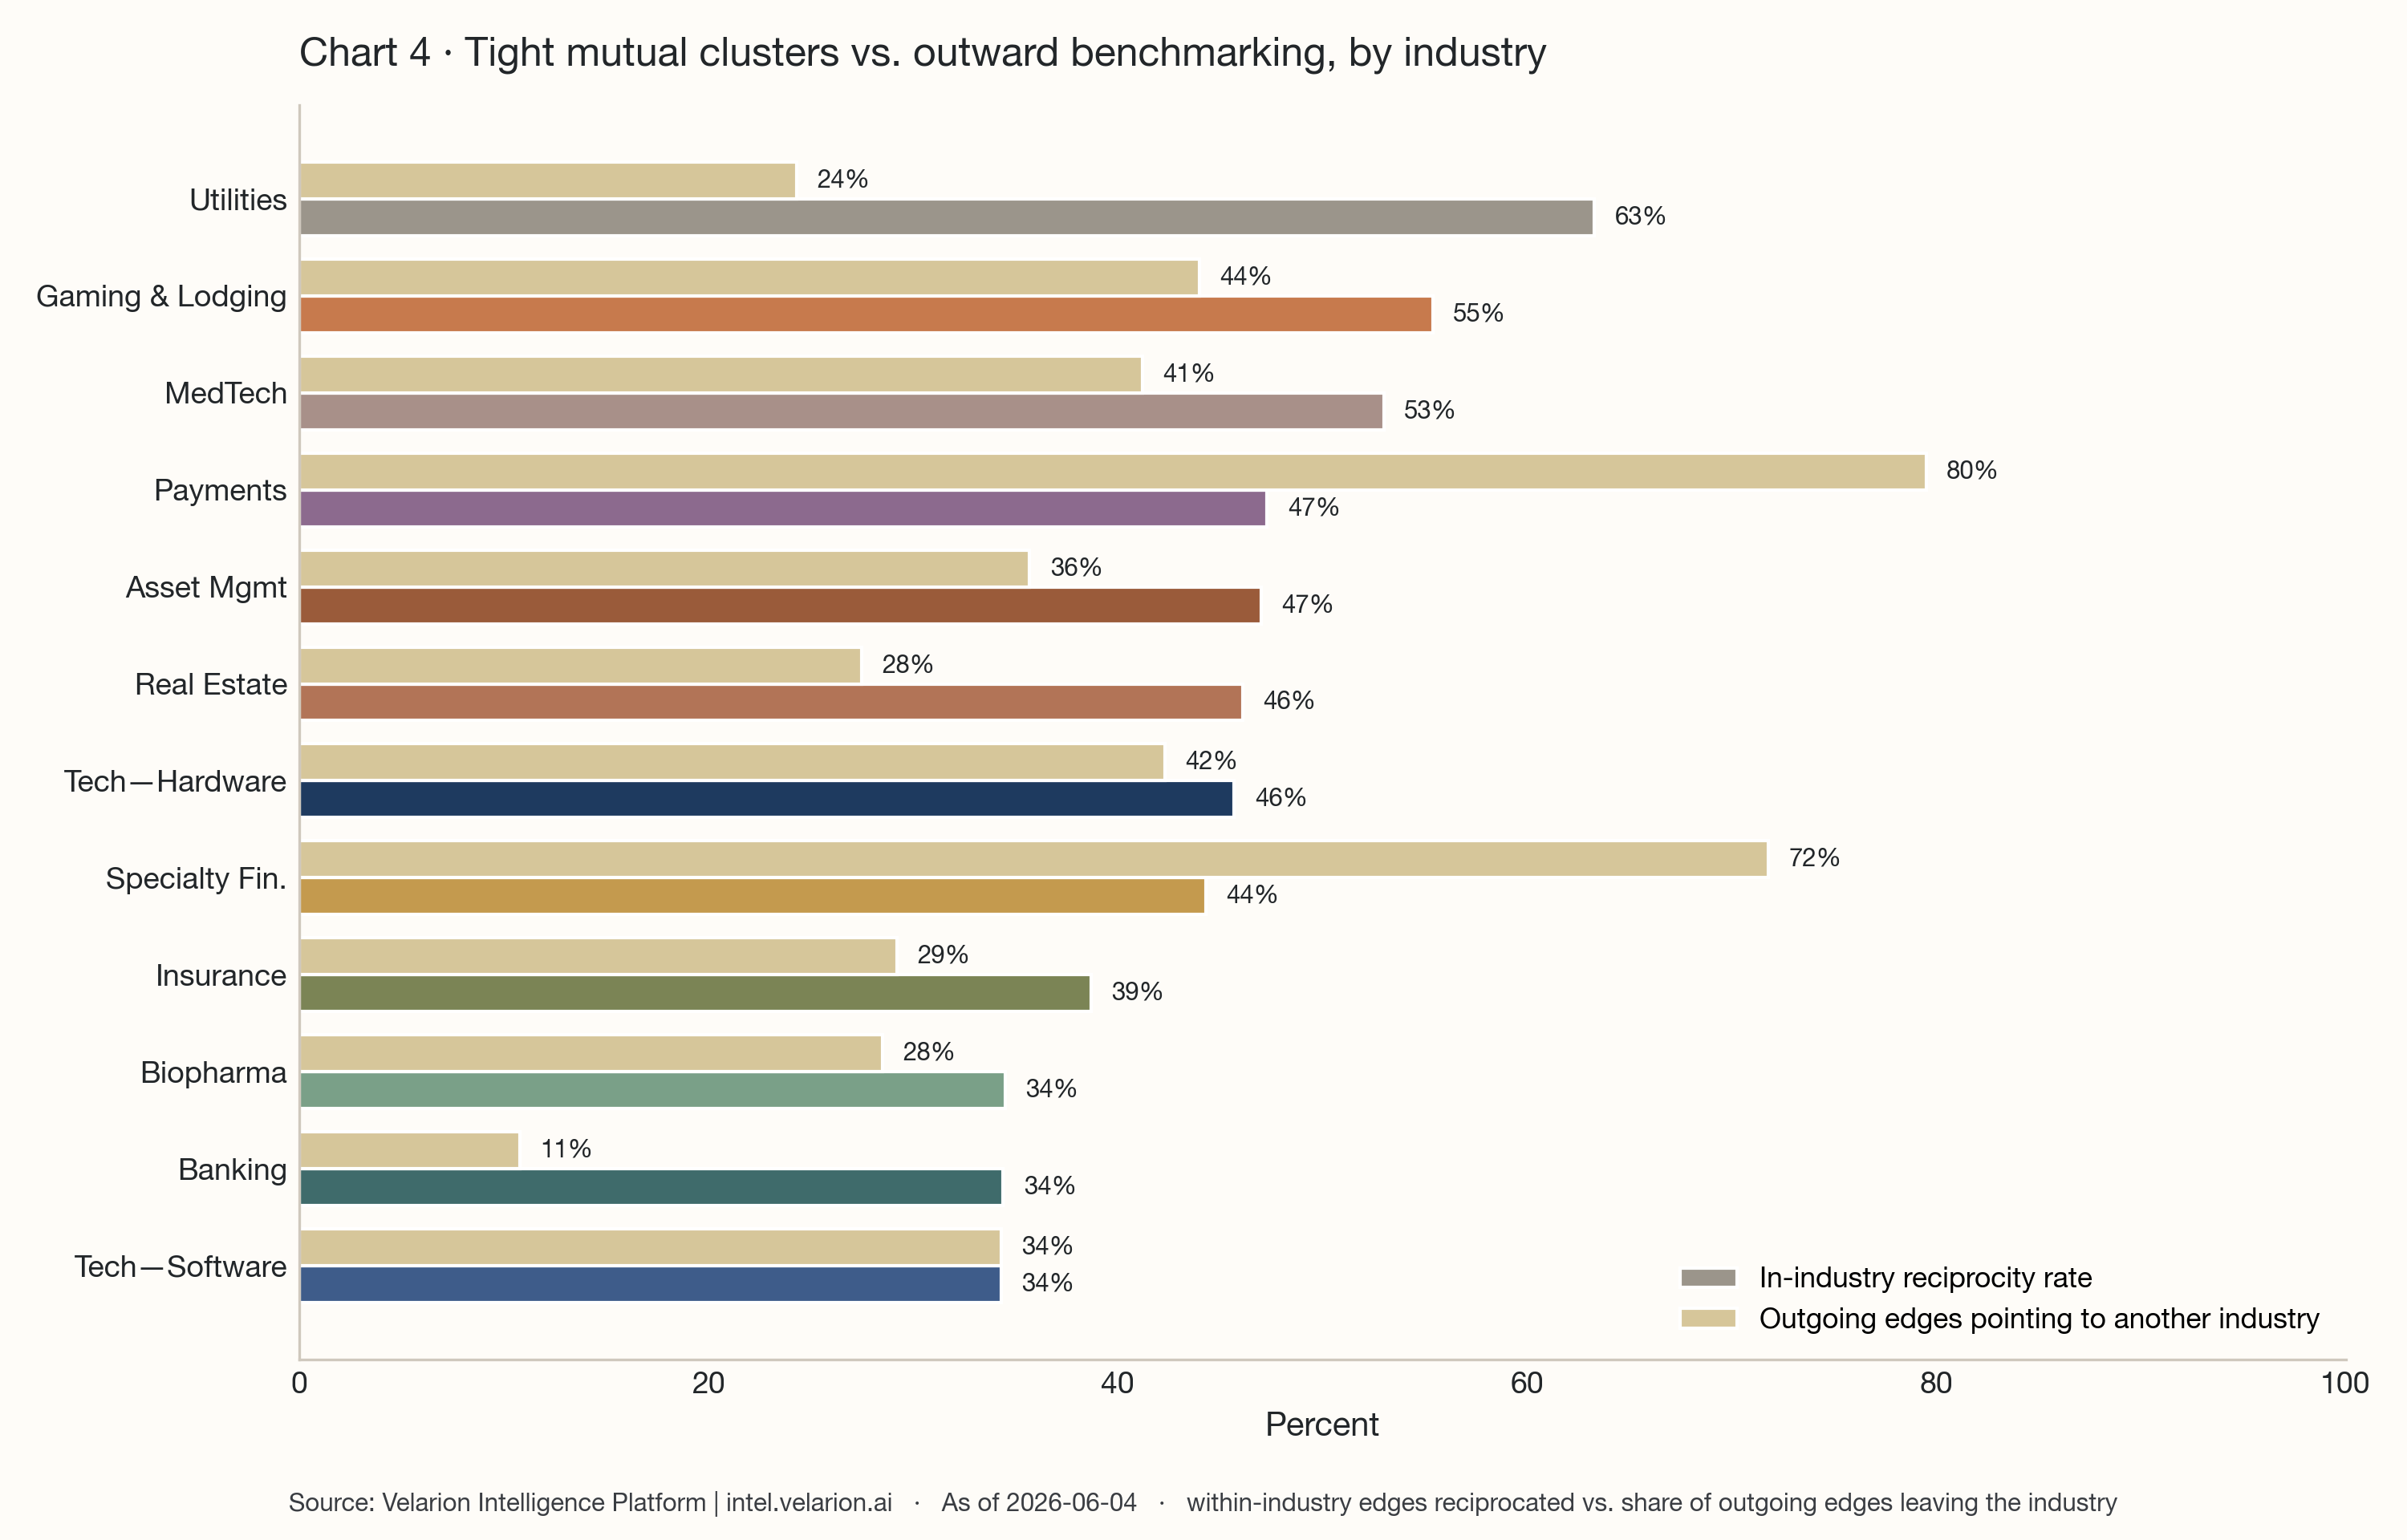
Utilities is the tightest, most self-contained community in the entire dataset: 63.3% of its within-industry edges are reciprocated, and only 24.3% of its benchmarking points outside the sector. Utility boards benchmark against other utilities, and those utilities benchmark back. Banking is the most insular by reach — just 10.8% of banking's outgoing edges leave the industry, the lowest cross-industry fraction of any sector, meaning roughly nine in ten bank peer relationships stay inside Banking — though its within-industry reciprocity, at 34.4%, is more moderate than its insularity would suggest. At the opposite pole sit Payments & Financial Infrastructure and Specialty Finance, which benchmark overwhelmingly outward: 79.5% and 71.8% of their outgoing edges leave the industry. These are small, recent-vintage cohorts whose members reach toward the larger Banking, Asset Management, and software names they resemble in business model. MedTech & Diagnostics (53.0% reciprocity) and Gaming & Lodging (55.4%) form moderately tight mutual clusters; the two large technology industries, by contrast, run lower within-industry reciprocity — Tech — Software at 34.3% — because their benchmarking is spread across a far wider set of names.
The investor reading is direct. A tight, high-reciprocity industry like Utilities or MedTech produces peer groups that are easy to defend and hard to game — everyone is named by the firms they name. An outward-benchmarking industry like Payments or Specialty Finance produces peer groups that require more scrutiny, because the reference set is, by construction, a set of larger firms in adjacent businesses. Neither pattern is wrong; they are different disclosure risk profiles, and they are visible at a glance in the industry one operates in.
The perennial core
The snapshot above is a single moment. Widening to all four fiscal years from FY2022 through FY2025 isolates a perennial core: the active-universe firms that ranked in the top fifty by in-degree in every one of those four years. Twenty firms qualify — and all twenty are enterprise-software companies.
The perennial core is Five9, BlackLine, Guidewire, PagerDuty, Okta, AppFolio, Dynatrace, HubSpot, Workday, Elastic, Salesforce, DocuSign, Q2 Holdings, Adobe, Dropbox, FICO, Autodesk, Palo Alto Networks, Twilio, and ServiceNow. These are the firms the market has benchmarked against, without interruption, across four consecutive filing years — the fixed stars of the peer-selection graph. The concentration is itself the finding: the stable center of executive-pay benchmarking in the United States is not the largest companies or the oldest, but the enterprise-software cohort that the rest of technology, and a good deal of the market beyond it, treats as the reference for competitive pay.
They are also markedly more mutual than the universe around them. The perennial core's median reciprocity rate is 0.727, against 0.364 for disclosing firms overall — the core does not merely sit on the most lists, it names back the firms that name it, at roughly twice the universe rate. Persistence and reciprocity travel together: the firms that anchor the graph are the firms that participate in it most fully.
Governance implications
The peer-selection graph and the say-on-pay record describe the same companies, and they can be read together. Of the 991 disclosing firms, 945 carry at least one say-on-pay record on our platform — a 95.4% join coverage rate, the same join-discipline standard Paper 1 applied. Plotting each firm's aspirational index against its most recent say-on-pay approval surfaces a pattern, not a law.
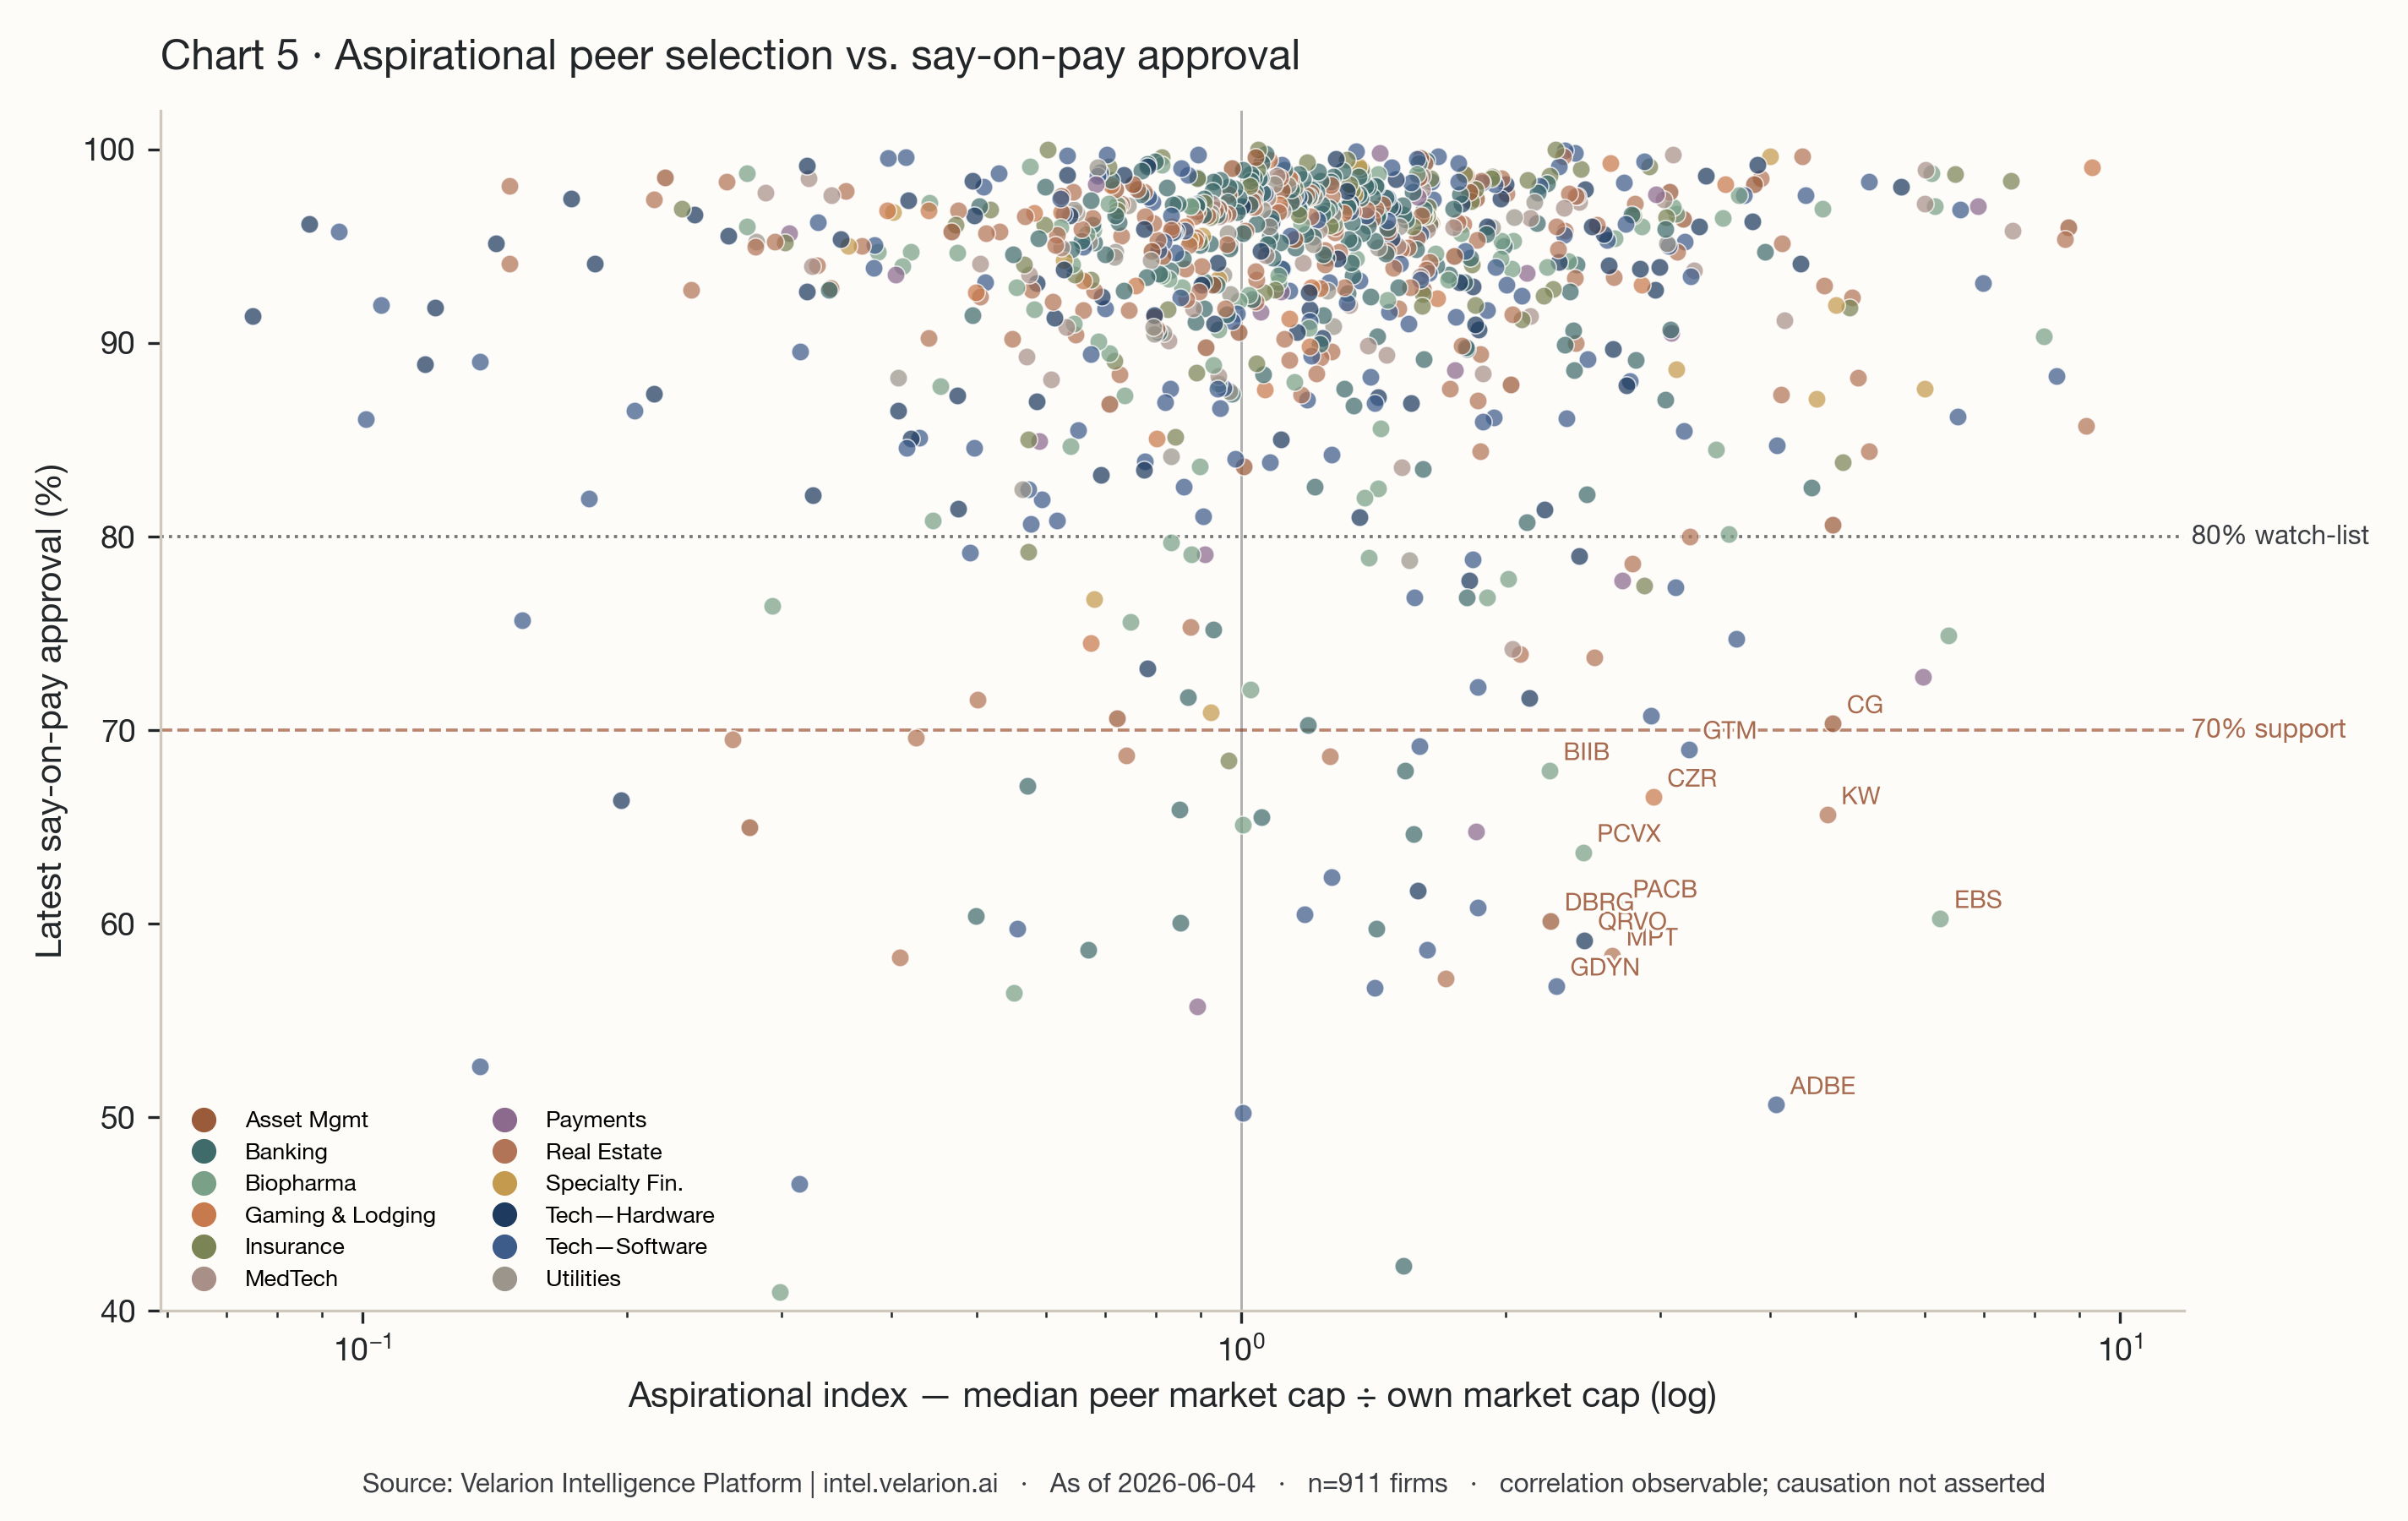
The broad mass of the universe sits where it should: modest aspirational index, approval comfortably above 85%. But a cluster of companies sits in the upper-right of the chart — a high aspirational index and a say-on-pay result below the 80% support line that institutional governance teams treat as a watch-list threshold. The cluster is cross-industry and specific. Penn Entertainment (PENN), at an aspirational index of 4.7, recorded 37.1% say-on-pay support; Adobe (ADBE), at 4.1, drew 50.6%. Medical Properties Trust (MPT), Qorvo (QRVO), DigitalBridge (DBRG), Emergent BioSolutions (EBS), Pacific Biosciences (PACB), Kennedy-Wilson (KW), Caesars (CZR), Biogen (BIIB), Carlyle (CG), and Repay (RPAY) all combine an aspirational index at or above two with say-on-pay support below 70 to 73 percent. Twenty-eight firms occupy that quadrant.
The reading is observational, and the discipline matters here more than anywhere. Companies with troubled say-on-pay outcomes typically have governance friction along several dimensions at once — peer-group construction, performance-share design, pay-mix opacity, change-in-control terms. An aspirational peer set is one observable signal among many, not a cause. It belongs in the same family as the one-time-award concentration this series examined in its first issue: two visible symptoms of the same underlying governance posture, the posture of a board whose pay decisions run ahead of its disclosure. We are describing a correlation in the data, and we name the cluster because the names are real and checkable. Correlation observable; causation not asserted.
Confidence and methodology
The peer-disclosure data underlying this paper is high-confidence in a way Paper 1's classification work was not. Companies disclose their compensation peer groups explicitly and by name in their annual filings; there is no narrative inference and no taxonomy judgment in the core edge — a named peer is a named peer. That removes the confidence-tiering Paper 1 carried. What remains are three honest limitations, stated plainly.
First, coverage. 83.7% of the active universe discloses a placeable peer group; 193 firms disclose none and are absent from every ranking. Second, resolution. Named peers that resolve to no public ticker — under two percent of raw disclosures — cannot be graph nodes and are excluded; so are self-references, of which there are none. Third, market-cap join. The aspirational analysis requires a clean market capitalization for both the company and its peers; we have one for 970 of the disclosing firms, and where a peer lacks a market cap it is dropped from that company's peer-median rather than approximated — we never substitute revenue or any other proxy for a missing market cap.
One data-quality note belongs in the open. A small number of disclosing firms — 21 of 970 — carry an aspirational index above ten, driven by peer lists that resolve to companies in an unrelated industry (a handful of small real-estate and mortgage firms whose disclosed comparator sets appear to have been captured incorrectly in the source extraction). We have flagged these for repair, excluded all 21 from the named standouts, and they are omitted from the scatter in Chart 3; the median and the named cohort above are unaffected. The figures in this paper are as of June 4, 2026, and they move with each new disclosure. The full graph construction, the SQL, the chart code, and a claims ledger ship alongside this paper; every number above traces to a row in it.
How to use this
Two audiences read this graph differently, and the investor reading comes first.
For investors
The graph is a triage instrument. Begin with the upper-right of Chart 5: portfolio companies that name a peer set well above their own size and carry a say-on-pay result in or below the watch-list band. That quadrant — Penn, Adobe, Medical Properties Trust, DigitalBridge, and the two dozen others named above — is where the relationship between peer-group ambition and shareholder dissatisfaction is most visible, and it is the first place a benchmarking question lands in a vote. Second, read in-degree as influence: when a company you hold names Five9 or Okta or Workday as a peer, it is anchoring its pay to the most-benchmarked firms in the market, and the percentile math follows from that choice. Third, use the reciprocity rate as a check on whether a peer group is mutual or merely aspirational — a peer set that names back is a peer set the market agrees with.
Want to see who a company you hold or cover names as its pay peers — and who names it back? Reply with one ticker and I'll send you its one-page network read. No charge, no pitch.
For companies
The same graph is a diagnostic on your own peer selection. First, compute your own aspirational index before a proxy advisor does: the median size of the peers you name, divided by your own. If it sits above two, the upward reach is large enough that the rationale needs to be written down before the filing, not reconstructed after it. Second, check your reciprocity rate — the share of your named peers that name you back. A low rate is not disqualifying, but it tells you the market does not yet see the comparison the way you do, and that gap is what an investor probes. Third, read your industry's structure from Chart 4: a company in a tight, high-reciprocity industry like Utilities or MedTech is held to a within-industry standard, while a company in an outward-benchmarking cohort like Payments has more latitude but less cover. The reference set that defends a pay number is the one the rest of the industry already agrees on.
Methodology
Graph construction. One directed edge per ordered (company, peer) pair, drawn from each company's single most-recent fiscal-year disclosure (FY2022 or later). Nodes are tickers; an edge runs from a company to each peer it names. Self-references and null-resolving peers are excluded (self-loops: 0; null-resolving peers: under 2% of raw disclosures).
Reciprocity rate (primary). For a company C, the share of C's named peers that name C back: |{p in peers(C) : C in peers(p)}| / |peers(C)|. Used in the league table, the cross-industry table, and every reciprocity claim in the paper.
Network density (descriptive, stated once). Mutual directed edges divided by total directed edges = 0.316. A mutual edge is an ordered pair (A,B) for which both A→B and B→A exist; 4,717 mutual pairs exist.
Aspirational asymmetry (headline). For each active firm C with a known market cap: aspirational_index(C) = median(market cap of named peers with a known market cap) / market cap(C). Firms at or above 1.5 are the names-up cohort. Missing peer market caps are dropped, never approximated.
Structural asymmetry (supporting). A firm is structurally asymmetric when out-degree ≥ in-degree + 5 and out-degree ≥ 2 × max(in-degree, 1). 237 firms qualify under these final thresholds.
Out-of-platform rule. Out-of-platform firms are nodes; their edges count toward active firms' in- and out-degree. They never appear in active-universe rankings, which are an active-universe-only denominator by deliberate choice. Out-of-platform industry is assigned by SIC: the platform's dominant-vertical-per-SIC map first, a standard SIC major-group rollup where an out-of-platform SIC has no active-universe analog, and neutral gray otherwise.
Universe and coverage. 1,184 active companies across 12 industries; 991 (83.7%) disclose a placeable peer group; 29,858 directed edges; 3,270 nodes (2,115 out-of-platform). The four financial-services industries — Banking, Insurance, Asset Management, Specialty Finance — are reported separately, never as one bucket.
Confidence and reproducibility. Peer disclosures are high-confidence: companies name their compensation peers explicitly, with no narrative inference. The figures are as of June 4, 2026. Full SQL, graph code, chart code, and a claims ledger ship with this paper; every numeric claim carries a ledger row.
About Velarion Intelligence
Velarion Company Intelligence (intel.velarion.ai) is a research platform covering executive and director compensation across twelve industries and approximately 1,184 active publicly traded companies, with an additional roughly 1,473 peer-benchmark companies held to identical quality standards. The platform combines structured analysis of public filings with classification systems across dozens of compensation taxonomies. Coverage refreshes nightly. The audience is institutional investors, governance teams, executive recruiters, and the compensation profession. This is the second issue of Velarion Observations; the first, The Hidden Retention Premium, examined off-cycle compensation across the same universe.